Policy Brief
Economic trends
Introduction
This Brief provides a summary of the key data on trends in the Jersey economy, in particular the major variables – economic growth, retail prices and earnings. It also summarises the analysis from the Government’s Fiscal Policy Panel (FPP), which includes forecasts for the next three years.
Summary
- Financial and insurance services account for 40.4% of Jersey’s economy.
- Jersey’s economy grew by 7.3% in 2023. The FPP forecast is for growth of 2.1% in 2024 and 0.6% in 2025.
- Retail Prices increased by 2.6% in the year to June 2025. The FPP’s May 2025 forecast was for an increase of 3.5% in 2024 and 1.7% in 2025.
- Average earnings increased by 6.4% in the year to June 2024. The FPP’s May 2024 forecast is for an increase of 7.7% in 2023 as a whole, and 5.2% in 2024.
- The FPP’s May 2024 forecast for house prices is no change in 2024 and increases of 2% in 2025 and 2026.
Structure of the economy
The annual report Measuring Jersey’s economy – GDP and GVA – 2023 was published on 4 October 2024. Table 1 shows a breakdown of Gross Value Added (GVA) by sector in 2023.
Table 1 Gross value added by sector, 2023
The breakdown is presented using the revised 2007 Standard Industrial Classification. The report notes that whilst most of these sectors are self-explanatory the following are worthy of particular comment –
- Financial and insurance activities includes a number of sub-sectors such as banking, trust and company administration as well as other financial service providers. It does not include legal and accounting services which have been traditionally included within the Jersey “Financial Services” GVA figures. These sub-sectors are now included under the “professional, scientific and technical activities” sector making international comparisons easier.
- Real estate activities includes rental income of private households which was previously presented separately. This includes both rental income earned by private households as well as owner-occupied imputed rental costs (a notional figure of the rent that would be payable on owner-occupied properties) , which represents 68% of the GVA in this sector.
- Public administration includes the Government of Jersey, non-ministerial departments and the twelve Parishes. It does not include trading entities such as the Ports of Jersey or Jersey Car Parks, which are classified under transport and storage.
- Professional, scientific and technical activities includes (as mentioned above) the activities of legal and accounting services.
- Other sectors includes all other sectors of the economy (this includes industries such as agriculture, transport and storage as well as manufacturing).
The key statistics on Gross Domestic Product (GDP) are –
- GDP increased by 7.3% in real terms compared with 2022.
- GDP was £6,575 million.
- GDP per head of population increased in real terms by 7.0% compared with 2022.
- GDP per head of population was £63,500.
- The increases in both GDP and GDP per head of population were above the previous 10-year average.
A sectoral breakdown of Gross Value Added (GVA) shows –
- The annual increase in overall GDP was driven by the financial and insurance activities sector, particularly as a result of increased net interest income in the monetary intermediation (banking) sub-sector.
- The largest percentage increase in GVA was observed in the financial and insurance activities sector which increased in real terms by 19.4% in 2023.
- Excluding the financial and insurance activities sector, the GVA for the rest of the economy increased in real terms by 0.4%.
Labour productivity, measured as GVA per full-time equivalent worker, increased by 8.8% in real terms in 2023. This annual increase was again driven by increased profits in the financial and insurance activities sectorwhich recorded a real-term increase in productivity of 19.8%.
Economic growth
The report gives links to detailed statistical tables, which enable the longer run performance of the economy to be analysed. The economy grew rapidly in the late 1990s and then was fairly stagnant until 2007. By 2013 the economy had shrunk by 15% and, given the increase in population, GVA per head had fallen by over 20%. There was then a steady recovery until 2020 when the pandemic caused a 10% reduction in the size of the economy. This was reversed in 2021 and strong growth of 6.2% was recorded in 2022. It was only in 2022 that GVA in real terms exceeded the 2000 figure. However, given the increase in population real GVA per head was 9% lower than in 2000. The strong growth continued in 2023.
Table 2 summarises these trends. The figures are taken from tables that can be accessed from the 2023 report.
Table 2 Growth of the Jersey economy 2012-2023
Retail prices and earnings
Statistics Jersey publishes quarterly retail price reports.
On July 23, 2025, the Government released the Jersey Retail Prices Index June 2025 report. Key points –
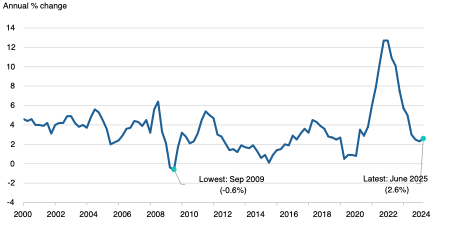
- the All Items Retail Prices Index (RPI) for Jersey increased by 2.6% in the year to June 2025 to stand at 239.0 (June 2000 = 100)
- the increase in the RPI was 0.3 percentage points more than that to March 2025 (2.3%) and 2.4 percentage points less than a year ago (5.0% in June 2024)
- leisure food and household services groups contributed to the increase since March
- leisure services which includes entertainment, sport and leisure fees, and off-Island holidays, was the price group that made the largest contribution to the annual rate of inflation, contributing +0.6 percentage point to the rate
- the housing group gave a slight downward contribution to the change in the annual rate of increase
- RPI(Y), which measures underlying inflation, increased by 4.0%
- RPI(X), which excludes mortgage interest payments, increased by 4.0%
- RPI Pensioners increased by 3.8%
- RPI Low Income increased by 3.9%
- annual changes in RPI(X), RPI(Y) and RPI Pensioners and RPI Low Income were 0.5 to 0.6 percentage points higher than those in March 2025
- the rate of inflation in Jersey as measured by the RPI, was 1.5 percentage points lower than the UK CPIH, which is the broadly comparable headline rate of inflation for the UK.
The following chart, taken from the report, shows the annual change in Jersey's RPI.
Figures on average earnings are published for June each year. Index of average earnings June 2024 was published on 22 August 2024.
The summary is set out below –
In June 2024:
- average earnings per full-time equivalent employee (FTE) were 6.4% higher than in June 2023
- after adjusting for inflation (the headline rate of inflation in Jersey in June 2024 was 5.0%), average earnings increased in real terms by 1.3%
- over the last 10 years, average earnings have decreased in real terms by 2.4%
- over the last 12 months:
- average earnings in the private sector increased by 5.9% in nominal terms (before adjusting for inflation) and in real terms increased by 0.9%
- average earnings in the public sector increased by 8.8% in nominal terms and in real terms increased by 3.6%
- on a sectoral basis:
- the agriculture and fishing sector was the only sector to record a decrease in average earnings (decreased 2.7% on an annual basis); this was driven by average working hours in the sector reducing by a greater proportion than the increase in the minimum wage (10.9%)
- the public sector saw the highest annual increase, up 8.8% on an annual basis; this was driven by an 8.0% headline pay award in the public sector as well as nurses and teachers receiving delayed pay awards from 2023
- median average earnings of full-time equivalent employees was £850 per week
- mean average earnings of full-time equivalent employees was £1,000 per week
Fiscal Policy Panel analysis and forecast
Statistics Jersey publishes statistics. Analysis of the statistics and forecasts for the future are made by Jersey’s Fiscal Policy Panel, a group of economists who provide the Government with independent advice on trends in the economy and the economic outlook. The Panel published its Economic Outlook on 19 May 2025. Its analysis of economic developments made the following points –
- The global outlook is weak and uncertain. An escalation of trade tensions and high levels of policy uncertainty have led to sharp downward revisions of global growth forecasts. In its latest projection the IMF has revised down global growth to 2.8% (2025) and 3% (2026) from 3.3% in both years. The IMF forecasts that UK GDP will increase by just 1.1% in 2025 (compared to 1.6% forecast earlier this year).
- The Panel’s central estimate is that Jersey’s Real GVA (i.e. economic output) fell by 1.5% in 2024. Falling bank profits, which comprised 20% of total GVA in 2023, was the primary given for this. Bank profits are mostly driven by deposit rates and capital flows, factors that are largely exogenous to Jersey, so the real decline is not necessarily representative of performance in the rest of Jersey’s economy.
- The non-financial sectors saw mixed results in 2024, with areas such as construction, real estate, accommodation, food services and retail experiencing declines due to rising costs, inflationary pressures and weakened consumer spending. However, other sectors such as the public sector expanded.
- Jersey’s labour market remains tight. The total number of jobs in Jersey grew by 0.8% in 2024 with 530 new jobs. However, this employment growth was largely limited to the public sector. Only 100 new jobs were created in the private sector. Private sector employment growth of 0.1% in 2024 was lower than 2022 (2.0%) and 2023 (1.3%), comparing June to June.
- The Panel has revised upwards its expectations for inflation in Jersey. The Bank of England anticipates higher food inflation this year, which will likely cause grocery prices to increase in Jersey in addition to the prospect of higher import costs. Underlying inflation RPI(X) increased in Jersey over Q1 2025, from 3.2% to 3.4%. This indicates that inflation generated on-island has increased and can be expected to persist. Further, the increase in the minimum wage (April 2025) as part of the transition to a living wage, will add to the mounting costs faced by businesses. The Panel expects that the living wage, along with agreed increases in the public sector pay award, will cause wage pressure across Jersey’s economy and risks creating more inflationary pressure. A period of elevated inflation is forecast for 2025 and 2026, before inflation returns to more moderate levels in 2027.
- Real GVA growth is expected in all years of the forecast period. However, growth is expected to remain subdued in 2025 with 0.4% real growth, considerably below the pre-pandemic average of 1.5%.
- The downward revision to the central real GVA forecast means Jersey’s economy will be operating below trend in 2025, creating a negative output gap, before returning to moderate levels of growth in 2026. This implies lower growth for Government revenues in the near term, particularly if real earnings fail to increase further in 2025. The labour market is expected to remain tight, limiting the growth in revenues made possible from new job creation.
- Jersey’s housing market followed an upward trend in both prices and transactions between 2011-2021, but since then the housing market experienced a flattening off in 2022 and then a significant downturn in 2023. This downturn has persisted, and the House Price Index fell by 8.2% in 2024, which is the largest annual decrease since 1986. The total number of housing transactions also reached its lowest levels since 2002. There are signs that activity in the housing market is beginning to pick up with turnover increasing in the last three quarters of 2024 and into 2025.
Table 3 shows the Panel’s forecasts for the main economic variables.
Table 3 Key economic variables, rate of change %
.
Further information
The Business and Economy Statistics page of the government website contains details of 11 relevant statistical series.
